Hazel performance analysis · ^report(1) · 2026-10-10
Why a slider isn't instant yet
Hazel livelits, on the playground slides, measured 2026-10-09 to 11. Branch #2635 (livelits × modular editors), dev builds, headless Firefox.
Newest: the code editor re-checks only the tiles whose sorts can move: on each commit, a chunk's top-level tiles and its derivation tiles, not every tile it holds (on mega-4k, 25,852 → 270 tiles). Profiled, the code editor's part of a release went from 26 to 8 ms, but release to face moved only 3–5 ms (132 / 134 / 130 ms, with / without / with), which is within the noise. The profiler overstated this one. The gain grows with the program, not on this slide.
Before that: another profile. The face now waits only on the main thread: the commit, the redraw of the commit, then the redraw with the result. Its largest single item, in the worker, is fixed: reusing a cached result walked the whole reused code (the worker's evaluation 47 → 25 ms profiled). Release to face didn't move, since the worker is off its path.
Earlier: the three next steps from the 10-10 profile (the worker's responses 393 → 16 KB, no forced layouts, the problems panel per tile; release to face 140 / 142 ms, and about 3.2 s on #2597); a profile that found the result collector re-indexing the whole program (44 → 6 ms profiled); a view re-evaluates only the calls whose inputs changed (the face's first evaluation 43 → 12.5 ms); the evaluator's overhead (the face's view 60 → 42.5 ms, then a further 16–25% on a benchmark); requests carry only what changed (478 → 18.5 KB); #2597 is about 10× slower, without #2469; the worker's reuse check by Merkle hash (~410 → ~145 ms per release, and 2.7 → 0.41 s on a dev benchmark).
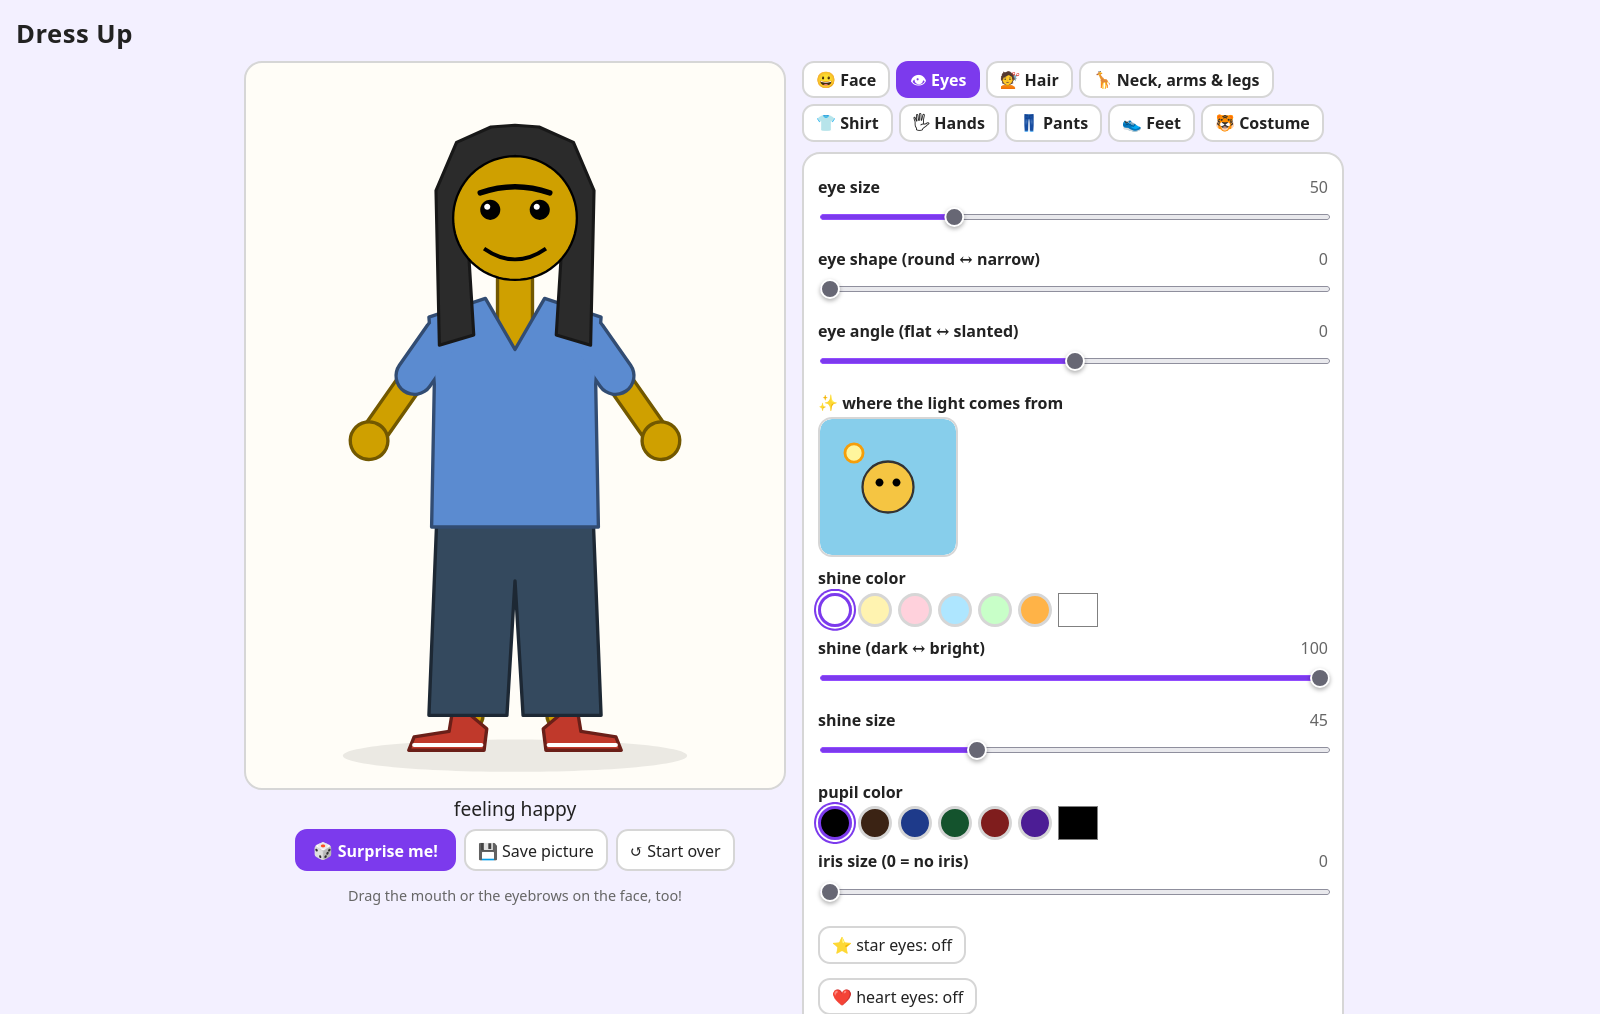
A slider change is the simplest thing a livelit can be asked to do: one number in one model changes, and something that depends on it redraws. In the Dress Up app it costs under a millisecond. In Hazel it now costs about 0.14 s, down from 4.6 s yesterday afternoon and from tens of seconds a few weeks ago. This report collects every performance problem we've found and fixed this fall, then looks at where the remaining time goes and what it would take to get to "immediate".
- Kids' Choice, Polygons, Shirt and Pants, Shoes and Hair on the live build of #2635 (livelits × modular editors), deployed from
31502d1e3d, which has every fix below. All the numbers here are from this branch. - The same slides on #2597's live build (the full livelits branch), deployed from
5286ba3b10. It has these fixes too, but not #2469’s, so a Kids' Choice release there takes about 3.2 s (below). - Dress Up, the plain HTML/JS app this report compares against (now called Messed Up Dress Up, by its players).
The live builds take several seconds to load a slide. The numbers here were measured on local dev builds of the same commits, in headless Firefox.
The same slider, at real speed
Both lanes start when the slider is released and finish when the picture shows the new value. They run in real time. The Dress Up lane finishes before you can see it move.
The Hazel lane's colours are its stages, in proportion to the CPU profile of the same release (see the next section); the total is the median wall time without the profiler. The 10-09 run is one colour: its stages were not split out the same way. So are the three newest: each is the mean of two twelve-release medians measured without the debug panel (140 and 142 ms now; 163.5 and 179 ms before the last three steps; 229 and 273 ms with the diff requests). The latest profile's stages are in the next section.
Where a release's time goes now
Profiled 10-11 on #2635 at 9129cd2774: six Kids' Choice releases, the first left out as a warm-up; profiled times are about 1.5× real ones. A timeline of the worker's messages, eight releases, gives the face's path: about 55–60 ms from the release to the request (the commit); about 35–40 ms in which the page redraws the commit, while the worker's answer arrives and waits; then about 45 ms from applying the result to the face's change. The face now waits only on the main thread: the worker evaluates while the commit is being redrawn.
| per release, profiled | where | ms |
|---|---|---|
| The redraws (the commit's, then the result's) | main | 104 |
| … livelit views: the face's evaluation 21, its Html to the page 8, probe sample views 7, the rest 8 | 44 | |
… the code editor (view_chunked), mostly sorts_of (15); since fixed | 23 | |
| … node views; footer; top bar | 10; 5; 5 | |
The commit: re-making the syntax (livelit placeholder shapes 9, of which gui_shape 7; per-item parsing 7) | main | 26 |
| The commit: building the request, almost all hashing its new values (15) | main | 17 |
| Statics; collecting the results; the after-display effect | main | 6; 5; 3 |
| The worker: evaluating 25 (was 47), planning reuse 13, encoding 6 | worker, off the face's path | 45 |
Added later on 2026-10-14: measured part by part (in node, release by release), the hashing was the smaller share of building the request, 1 to 4 ms. Most of it was building the request's projection of the statics, by walking the last statics map and the new one, whole; that now takes under a millisecond on every Livelit Playground slide. ^report(13).
Fixed with this profile: reusing an evaluation walked the reused code. When the worker reuses a cached result, it copies the cache entry of every node below it into the new cache, and it walked the whole reused subtree to find them: on a slider release, nearly the whole program, 16 ms of its 47 ms evaluation. Entries are recorded only for nodes evaluated outside any call, so the walk now stops at function bodies, as the result collector's index does (#2635 9129cd2774, #2597 5286ba3b10). The worker's evaluation went from 47 to 25 ms and its work per release from 69 to 45 ms. Release to face did not move (154 / 143.5 against 140 / 142 ms), since the worker is no longer on the face's path. On real caches (275 entries on mega-1k; a generated program on #2597) the copy equals the full walk, kept in the tests as the reference.
Fixed since: the code editor re-checked every tile's sort on every commit. The code editor draws the program in chunks of whole lines and reuses a chunk's drawing while the sorts its tiles show (the colours) are unchanged. Every commit brings new statics, and that re-checked every tile of every chunk: a lookup and a mold rebuilt per tile, over the whole program. A tile shows two sorts, and each can move only for some tiles: the parser's only for a chunk's top-level tiles, since below them sorts follow the code itself; and the one statics refine only for derivation tiles. A chunk now lists those tiles once, when it is drawn, and a commit re-checks only them (#2635 31502d1e3d; the chunked code view is #2469's, so there's nothing to port to #2597). Tiles re-checked per commit: mega-1k 4,115 → 36, mega-2k 11,624 → 114, mega-4k 25,852 → 270. On a Kids' Choice release, profiled: the check 16 → 0.3 ms, the code editor 26 → 8 ms. But release to face, twelve releases each, with the change, without it, then with it again: medians 132 / 134 / 130 ms, means 148 / 152 / 145. That's 3–5 ms, inside the spread of single releases (107–206 ms). A test checks over 36 real edits that the narrow check never reuses a chunk the full one would redraw, and that it does redraw when a sort moves. In the browser, an edited derivation program drew the same classes, token for token, as a fresh load of the same text.
Next, by payoff: find which of the request's values are new on each commit, probably the elaboration's spine down to the changed item and the statics table's changed paths, and keep their identity (15 ms of hashing, profiled; started); and make the redraw of the commit cheaper, since the face's redraw waits for it. After the sort check, take these profiled numbers as upper bounds: code made of many small calls looks several times costlier under the profiler than it is.
The previous profile (10-10, late), and the four fixes it led to
Profiled 10-10, late, on #2635 at 42902c2d2a: six Kids' Choice releases, the first left out as a warm-up. Profiled times are about 1.5× real ones. A release's work is spread over the main thread and the eval worker, and over the several redraws a release causes.
| per release, profiled | where | ms |
|---|---|---|
| Redrawing the page, over the release's redraws | main | 151 |
| … livelit views: the face's evaluation 19, its Html to the page 12, probe sample views 9, the rest 10 | 50 | |
… the code editor (view_chunked, sorts_of lookups) | 19 | |
… the problems panel (incomplete_tiles_deep) | 19 | |
| … node views; footer; top bar | 17; 7; 7 | |
| The worker evaluating the change | worker | 48 |
| The worker marshaling its response | worker | 44 |
| The commit: re-making the syntax | main | 30 |
A layout-measuring effect that forces a synchronous style and layout flush (update_main_scroll_width, solve_container) | main | 24 |
| The commit: building the request | main | 17 |
| The worker planning reuse | worker | 16 |
| Decoding the worker's responses | main | 14 |
| Statics; collecting the results (was 44, fixed) | main | 7; 6 |
Collecting the worker's streamed results indexed the whole elaborated program, a number for every node, whenever the elaboration was a new object, which is after every commit. The index is only looked up for nodes evaluated outside any function call, and a livelit's definition is mostly function bodies, so it now stops at them (42902c2d2a; an id it lacks would only mean the old full walk). Its parity test now also checks the full walk is never needed: 0 of 536 chunks.
Done since that profile
- The worker's responses carry only what the page doesn't have (#2635
90994d4443, #2597526200d05a). The worker shares its messages the way requests are shared, by Merkle hash the other way round: a release's result went from 393 KB to 15–16 KB, the worker's encoding from 44 to 5 ms and the page's decoding from 14 to about 7 ms (profiled). If the page meets a reference it cannot resolve, it ignores the rest until the worker starts over, and asks for the evaluation again. One surprise, found with a timeline of the messages: the face is drawn from the stream message, and the big result used to land after that paint. The small one came 3 ms after the stream and was applied in the same frame, so the face waited for it; now a result that comes before the stream's paint is applied just after it. Back to back, release to face 154 / 152.5 → 148.5 / 145.5 ms; on #2597 about 3.9 → 3.2 s, and loading Shoes and Hair 12.9 → 10.8 s. - A redraw no longer forces three layouts to measure the page (#2635
3c270617e2, #259799bb432fdb). The probe displays beside the code are measured all at once, then placed, and written only when they move; the page's scroll width is only grown on a commit, read after the displays are placed, and measured exactly (which rewrites a document-wide CSS variable twice) 400 ms after things settle. The after-display effect went from 24 to 3.6 ms, and main-thread work per release from 246 to 207 ms (profiled). Release to face is unchanged: it fires at the DOM change, before these effects. The published width equals an exact measure once settled, grows at once under a 5000 px overlay, and shrinks back after it. - The problems panel reuses what it found for unchanged tiles (#2635
0560e5a124, #2597f2b519fa52). Finding the incomplete tiles walked the whole program for every redraw with new syntax; each tile's answer is now remembered by the tile's identity, and an edit keeps the unchanged tiles. The panel went from 13 to 3 ms, the walk everywhere from 6 to 0.2 ms; release to face 147.5 / 144.5 → 140 / 142 ms.
Not fixed, found on the way: on #2597, after loading Shoes and Hair, the published scroll width is 1556 px where the content needs 2207, so a cell's background stops short. It was so before the change; the content grows after the last change that triggers a measure.
Where the 0.4 s went (an earlier profile)
This profile is from 10-10 afternoon, at 0.43 s a release, before the diff requests, the evaluator and view changes, and the collector fix; the section above has the latest. It is kept because it shows the shape of a release.
A slider release in Hazel is a program edit. The new model is written back into the program text, and everything that depends on the text runs again. In Dress Up, a release changes one field of one object and redraws.
Two things stand out:
- The worker now takes about 145 ms per release (profiled), down from about 410 ms. Deciding what to reuse took about 280 ms of that; it now takes about 26 ms (below). Redrawing is now the largest cost, about 310 ms profiled. It isn't the browser's layout or DOM work (about 30 ms): it is Hazel rebuilding its view in JavaScript, once per redraw, and a release redrew six times (now four).
- Everything else is many medium costs, each touching the whole program somewhere: re-building terms, encoding a 478 KB request, decoding a 383 KB response, redrawing the editor.
Statics, which a "skip statics" toggle would remove, is now 16 ms of it.
Finding · fixed
Incremental evaluation's reuse check cost more than it saved
The eval worker does evaluate incrementally: it keeps the last run's results and reuses them (#2606). But before each run it decides what it can reuse by comparing each cached entry's expression with the new program structurally, which is O(program) on every request. On a slider release that checking costs more than the re-evaluation it avoids:
Added later on 2026-10-13: what it keeps and reuses is a top-level binding's result, named by the editor's id of that binding and found the same by its content (a Merkle hash, ids included). After a slider release it evaluates again every binding that uses the slider; on the Playground's figure slides that is the whole picture: its update cost is about nine tenths of a run from scratch, though the release changes a few of the picture's shapes (^report(10)). What names inside the picture could reuse is the subject of ^report(10) and ^report(11).
This is the same shape as the problem #2661 fixed for types, where the evaluator compared two copies of the Html type at every node. It has the same fix: Merkle hashes on expressions, so that recognizing an unchanged expression is O(1).
The fix, and why hashing alone wasn't enough
A new Util.ValueHash hashes any immutable value by its structure, ids included, and keeps each object's hash. The reuse check now first asks whether the whole elaboration is the same build, and otherwise compares with a hashed equality, where identical subterms are equal without a walk.
That fixed Kids' Choice, but a benchmark on dev showed it was still quadratic. The program was 400 definitions, with an edit to the last literal. That edit sits inside every enclosing let, so every check along that spine still walked down to it, now also paying for hashing. The fix is to remember the answer for each pair of subterms compared, so every check after the first is a lookup.
| Re-evaluation after one edit | before | hashing only | hashing + pair memo |
|---|---|---|---|
dev, 400 definitions, edit the last literal (node, median of 7) | 2,743 ms | 4,353 ms | 410 ms |
| Kids' Choice slider release: the worker (Firefox, profiled) | ~410 ms | ~135 ms | ~145 ms |
Kids' Choice: reuse_check alone | ~283 ms | ~31 ms | ~26 ms |
On the dev benchmark, the slowest run after the change (502 ms) beat the fastest before it (2,418 ms). On Kids' Choice, the two hashed versions are the same within noise.
The shortcut is sound only where identical terms really are equal: no renaming of variables, and no lookup environments or free-variable handler in the comparison. It's off for every other caller.
The fix is #2673 to dev, and on the livelits branches 5237161017 + 97c910f69c (#2635). Since then, the request shares its unchanged values with the last one, so the reuse check finds them the same by identity before any hashing.
Finding · fixed
A view re-evaluated every call, though one input changed
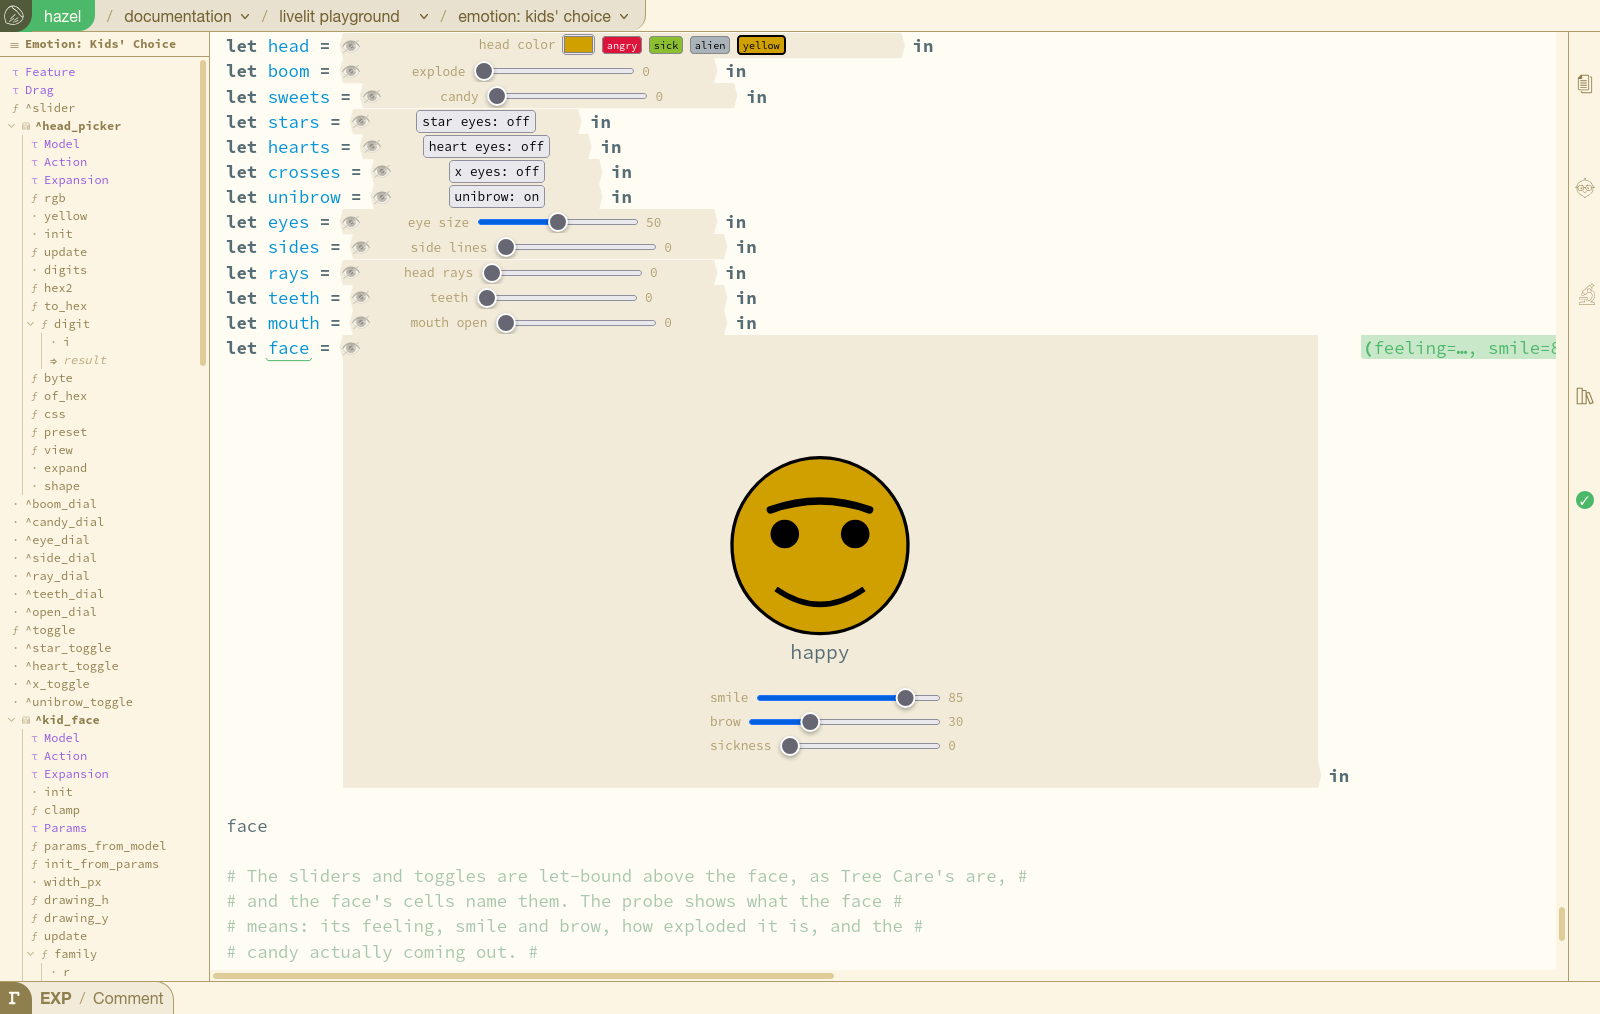
A livelit's view is evaluated again after each change of its model, and most of its calls are the calls of the last evaluation, made again. A new eye size on Kids' Choice changes the arguments of the face's two eye calls; sides_of, pieces, the brow, the mouth, teeth_of, sick_pile, mood and the face's three own sliders are called with what they were called with before.
Now a view's evaluation remembers its calls (Language.CallMemo). A call is identified by its function's body and the values of the variables that body reads, compared by structure with ids left out, since each evaluation mints new ones. A closure among those values compares by its code and the values it reads, not its whole environment, which holds the new model even for a helper that never reads it. "The variables a body reads" is every name that occurs in it as a variable: more than it reads, which can only cost a reuse, never give a wrong one. Only calls that took at least 40 steps are looked up or remembered. Only view evaluation uses it: a view's evaluation is pure (randomness and effects are commands, run after).
Added later on 2026-10-13: in the terms of ^report(11), the memo keys a call by its content (its code and the id-free values its code mentions), not by a name. Two kinds of id stay in the key: those of types, as said below, and those of a module value's items, which each evaluation mints afresh, so a call whose inputs hold a module value made by another evaluation is not recognized (^report(10)).
| #2635, same session | without | with |
|---|---|---|
| the face's view, first evaluation after a release (median of 12) | 43 ms | 12.5 ms |
| Kids' Choice, release until the face redraws (median of 12, two runs) | 211.5, 239 ms | 195, 203 ms |
| loading Shoes and Hair / Shirt and Pants | ~7.0 / ~6.3 s | ~7.4 / ~6.6 s |
The first version slowed loading Shoes and Hair by 2 s, and the profile showed why twice over. A recursive helper walking a picture's list is called on each tail, and each call's key put the tail in form again: now each node's form is remembered by identity, so shared tails are done once. And values carry casts with the large Html type, which the key copied every time: now types are kept as they are (they are the livelit's own, the same objects each time). What remains is the first evaluations recording their calls, a few hundred milliseconds of a load.
The face's picture after each of 13 changes (eye size, mouth, teeth, smile, explode, candy, side lines, rays, sickness, brow) is identical with and without the memo, on both branches, and each change did change it. Five new tests, one of which fails if closures are compared by code alone (checked by making that change). #2635 c64c558e86, #2597 67eb9d92d6.
Finding · fixed
Every release sent the worker the whole program
Each request to the eval worker carried the whole elaborated program and its statics table, 478 KB of Marshal, though a slider release changes one model value. Encoding it was about 52 ms (profiled) of the commit, on the main thread; decoding it was about 22 ms on the worker. And the decoded request was all new objects, so the worker's reuse check had to hash its way to what was unchanged.
Now both sides keep a table of the values the worker holds, keyed by the same Merkle hashes as the reuse check (Util.ShareCodec). The client sends a value the worker already has as a small reference carrying its hash, and the worker swaps each reference back for the value it kept. So a request is the changed paths plus references, and the worker's new request shares its unchanged values with the last one, which the reuse check sees by identity. If the tables ever disagree (a new worker, a cleared table, a request too deep to walk), the worker answers Resend and the client sends everything once; it also starts over when its table passes 200,000 entries.
| Kids' Choice, one slider release | before | after |
|---|---|---|
| the request, encoded | 478 KB | 18.5 KB (the first request after a load is still whole) |
| release until the face redraws, median of 12 (no debug panel) | 359 ms | 228.5 and 272.5 ms (two runs) |
| Shirt and Pants, one edit (playground check) | ~0.9 s | 0.1–0.2 s |
| Shoes and Hair, first edit (playground check) | ~1.0 s | 0.3–0.5 s |
The "before" is a matched baseline: the build just before, 9d9d40dae2, measured the same way the same evening. Runs of the new build vary by about 40 ms between them.
The fix is #2635 993e3d5f91 and #2597 8cd828706e, with four new tests: a value arrives equal to what was sent; a second request is small and reuses the worker's values; a reference the worker doesn't hold is an error, not a wrong value; after a reset, everything is sent again. On #2597 a release is still about 3.9 s: there it is whole-program statics, not the request, that costs (below).
And the first release after a load
The first slider release after a page load re-parsed the whole program, including the face's 8,612-piece definition: its commit took 245 ms instead of about 60. Loading fills the syntax pass's parse cache, but releases read statics' per-item cache, which stayed empty. The syntax pass now fills that one too (#2635 9d9d40dae2), and the first release's commit takes 55–63 ms like the rest. #2597 has no per-item parsing (it is #2469's), so this one doesn't apply there.
Finding
The full livelits branch is about 10× slower: it doesn't have #2469
The same Kids' Choice slider release, same machine, headless Firefox, median of 12: 3.76 s on #2597, about 0.35 s on #2635. Both redraw about as often per release. The difference is one step: after a livelit commits its new model, #2597 spends 2.3–2.7 s on the main thread before it can redraw, where #2635 spends about 60 ms. A CPU profile of one #2597 release (5.8 s profiled):
| part of a release on #2597 | profiled | on #2635 |
|---|---|---|
statics, from scratch, on the whole program (CachedStatics.init) | 3.5 s | per item, only what changed: ~16 ms |
| rebuilding the view | 1.6 s | ~0.37 s |
… livelit view samples run again (live_html) | 0.57 s | not in the profile (unexplained: the code is the same) |
| … the code view, with no cache | 0.41 s | cached |
| … the incremental-eval overlay, drawn though it is off | 0.39 s | skipped when off |
| parsing the whole program again | 0.2 s | per item |
#2635 is #2597 plus dev plus #2469 (Modular editors, by Andrew Blinn), and it is #2469 that brings per-item statics (5e99ad8a4d), statics projection (64aeb86349), the code-view cache, the worker's stream throttle and slimmed responses (a05f8e5791), and the gates that keep idle frames and the pending sweep quiet (101757e1ed). None of these is on dev or on #2597.
So the fixes this report lists are on both branches, but a slider release is only fast where #2469 is too. The ways forward: measure and demo on #2635; port the smaller pieces of #2469 (the overlay gate, the code-view cache) to #2597 (per-item statics is the core of #2469, and porting it is the merge #2635 already is); or keep a livelit's change out of the text path (step 3 below), which would skip whole-program statics on #2597. On #2635 that step is no longer worth building: per-item parsing and statics already make the text path about 10 ms. A release on #2597 with the diff requests is still about 3.9 s, since statics, not the request, is its cost.
How we got here
Runs vary by about ±0.07 s, so the reuse-check step is smaller than the noise in any one run; the worker's own time (410 → 145 ms profiled) is the steadier measure. * The last three bars are measured differently: without the debug panel, median of 12 releases, two runs; the build before the first of them measured 0.36 s the same way. The TypHash fix (#2661) doesn't show on this slide; it was the Polygons click's big fix (15–17 s → 2.0–2.2 s profiled).
Every problem found this fall, and its fix
Tags: super-linear grows faster than the program; repeated work the same answer computed again; unshared copy a copy where a reference would do; identity lost a cache missing because objects were re-made; data size; scheduling.
| Problem | Kind | Fix | Status | Measured |
|---|---|---|---|---|
| Every let-bound function took the recursive path; passes multiplied with nesting, 4depth | super-linear | #2603 | open | nested lets 400 s → 0.6 s; statics 20–30% faster |
| Jump to a projector walked the caret token by token | super-linear | #2602 | merged | ~190 ms per projector click → direct |
| Loading text the fast parser rejects: quadratic fallback parser (finding 1) | super-linear | #2610, #2614 | open | corpus 1,242 s → 433 s (both); Kids' Choice 227 → 93 s |
| Each run shipped the whole incremental cache to and from the worker | data size | #2606 | open | responses 86–98% smaller |
| Elaborations carried the source's whitespace and comments | data size | #2608 | open | requests 12–49% smaller |
| A module's definition analyzed twice | repeated work | #2651 | open | 1.8 s of a slide's 4.2 s statics |
| A livelit definition analyzed twice (synthesis, then analysis) | repeated work | #2635 76ecb91394 | livelits | Shirt and Pants statics 4.3 → 2.8 s |
| Firefox: worker couldn't start while the page was busy; late timers killed it | scheduling | #2652 | open | "Evaluation timed out" slides now draw |
| Statics re-ran 3× per edit (probe pins compared to the wrong keys) | repeated work | #2635 d42ae8193d | livelits | head-colour slider 20.6 s → ~2 s (10-01) |
| The builtin Html type written out in every ascription; Macro uses closed over all builtins | data size | #2597 4eeebeaff3, 6b42a0e09a | livelits | a slide's request 609 → 224 KB |
| Every livelit use evaluated the whole livelit definition, then copied it unshared | unshared copy | #2635 54543edc6b | livelits | Shoes and Hair analyze 4.3 → 2.0 s |
| Statics analyzes some expressions 3× per multiplier: recursive lets, shadowing a builtin, a label on an unannotated parameter (finding 10) | super-linear | counted: --count-passes, CI group StaticsPasses | not fixed | B2T2 programs up to 12× per expression; 3d for nested recursion |
| The evaluator compared two copies of the Html sum type, a full meet, at every node of a view | repeated work | #2661 (Merkle-hashed types) | open | Polygons click 15–17 → 2.0–2.2 s (profiled) |
| Livelit definitions and views were "finished": every helper copied into every closure, per event and per redraw | unshared copy | #2635 d706d4d1ec | livelits | Kids' Choice 4.6 → 1.6 s; Polygons → 0.17–0.19 s |
| A projector update re-made every piece of the program, so per-item parsing re-parsed all of it | identity lost | #2671; #2635 cefa5c2c5c | open | Kids' Choice 1.6 → 0.8 s |
| Every redraw evaluated every livelit's view, changed or not | repeated work | #2635 4239ecf04f | livelits | Kids' Choice 0.8 → 0.53 s |
The worker's reuse check compared every cached expression with the new one structurally; an edit inside many lets was walked to once per enclosing let | super-linear repeated work | #2673; #2635 5237161017, 97c910f69c | open | worker 410 → ~145 ms per release (profiled); dev benchmark 2.7 → 0.41 s |
| Each message from the eval worker was its own action, and the page rebuilds its view after every action: six redraws per slider release | repeated work scheduling | #2635 b481a876e1; #2597 d92f446112 | livelits | 6 → 4 redraws; main-thread work per release −15–30% |
| Redraws that showed nothing new rebuilt sub-views from unchanged inputs: the code view (its cache keyed on a record rebuilt with every result), closed event handlers, printed probe values | repeated work identity lost | #2635 51df91d5d7; #2597 a15af020ea (without the code-view part, which is #2469’s) | livelits | view building per release 157 → 138.5 ms |
| Cursor info rebuilt the program's source and compared it structurally on every redraw | repeated work | #2635 4d591fc2bc (Merkle hash, last answer kept) | livelits | ~40 ms profiled per release |
| The first slider release after a load re-parsed the whole program: loading filled a different parse cache from the one releases read | repeated work | #2635 9d9d40dae2 (per-item parsing is #2469's) | livelits | first release's commit 245 → 55–63 ms |
| Every request sent the worker the whole program and its statics, though a release changes one value; the worker then had to find the unchanged parts again | data size identity lost | #2635 993e3d5f91; #2597 8cd828706e (Util.ShareCodec) | livelits | request 478 → 18.5 KB; release to face 359 → 229–273 ms |
| Evaluation minted each id by copying a byte buffer and converting it to a string; ids, variable names and ints were compared with the polymorphic compare | unshared copy repeated work | #2635 7a5667e6f2; #2597 802d0eefd3 | livelits | face view evaluation ~61 → ~60 ms median, ~58.5 → ~53.5 min |
| Each recursive call of the evaluator re-applied it to the run's five constants: a closure per node, and every call through js_of_ocaml's generic path | repeated work | #2635 857c293962; #2597 960b3a21eb | livelits | face view evaluation ~60 → ~42.5 ms (−30%) |
| The evaluator made its stages as eight fresh closures at every node, and two stages bound a step only to pass the value through | repeated work | #2635 2d35bb9e01, 602498d7aa; #2597 9d2ff96dc7, d51eaacfa6 | livelits | call-heavy benchmark −16% (min), −25% (median) |
| A view was evaluated whole after every change of its model, re-making the calls whose inputs had not changed | repeated work | #2635 c64c558e86; #2597 67eb9d92d6 (CallMemo) | livelits | face view's first evaluation 43 → 12.5 ms |
| Collecting the worker's results re-indexed the whole program, function bodies and all, after every commit | repeated work | #2635 42902c2d2a (the collector is #2469's; not on #2597) | livelits | 44 → 6 ms profiled per release; release to face 195 / 203 → 163.5 / 179 ms |
| Each worker response was sent whole: a release's result was 393 KB, and marshaling it took as long as evaluating | data size identity lost | #2635 90994d4443; #2597 526200d05a | livelits | result 393 → 16 KB; worker encode 44 → 5 ms profiled; #2597 release ~3.9 → 3.2 s |
| After each redraw, measuring the page forced three layouts and two document-wide style recalculations | repeated work scheduling | #2635 3c270617e2; #2597 99bb432fdb | livelits | after-display effect 24 → 3.6 ms profiled |
| Finding incomplete tiles walked the whole program for each redraw with new syntax (problems panel, outline) | repeated work | #2635 0560e5a124; #2597 f2b519fa52 | livelits | problems panel 13 → 3 ms profiled |
| Reusing a cached result walked the whole reused code to copy its descendants' cache entries, though function bodies never have any | repeated work | #2635 9129cd2774; #2597 5286ba3b10 | livelits | worker evaluation 47 → 25 ms profiled (off the face's path) |
| The code editor re-checked every tile's sort on every commit, to decide which chunks to redraw, though only top-level and derivation tiles can change | repeated work | #2635 31502d1e3d (the chunked code view is #2469's; not on #2597) | livelits | code editor 26 → 8 ms profiled; release to face −3–5 ms; mega-4k 25,852 → 270 tiles per commit |
| #2597 re-analyzes the whole program after every livelit commit; it doesn't have #2469’s per-item statics | repeated work | in #2469 and #2635, not in #2597 | not fixed | 3.5 s of a 5.8 s release (profiled) |
Still open from #2609, without a fix: paste in the middle of a program falls back to the quadratic parser; long modules make MakeTerm worse than linear; the CLI hangs after an error report; a long paste can hang the page; and Shirt and Pants could lose a click. That one is now explained: each time the app re-measures its font (at load, when web fonts settle, on zoom), SetFontMetrics asks the editor to scroll the caret into view, and on a fresh slide the caret is at the top. A late re-measure jumps the editor about 10,000 px while you are scrolled down to the shirt, so the click lands on text. Fixed in 47f7f48397 (#2635): a font re-measure now keeps the scroll position. Not a performance bug, but on the same slide: the pants' editor drew them in its canvas's top-left corner, half cut off, because they were drawn from (0, 0); they are now centred (#2635 30758d0977, #2597 33126fdffe), and the outfit is unchanged.
What the list has in common
Work on the whole thing, inside a loop over its parts
Per character, re-process the whole run. Per let, re-analyze the whole definition. Per click, walk the whole program. Per use, evaluate the whole definition. Per variable, copy in its whole value. Per redraw, evaluate every view. Each is linear on its own; inside a loop it becomes quadratic, and nested it becomes exponential.
Caches that key on object identity break silently
Per-item parsing, the layout cache and the statics cache reuse work when they see the same objects as last time. One helper that re-made every object (MapPiece) turned all of them off at once, with no error, just slowness. A hash of the content (TypHash) survives copies. Identity is cheaper when it holds; a hash is safer when something upstream might copy.
Added later on 2026-10-13: identity or content is one axis of a design space of names: what each cache is keyed by, and what that key survives. ^report(11) sets it out for the evaluator, with Fumola's rule: what is edited gets a name that stays put while its value changes, and what is derived is found by its content.
Measure where the user is
Node said statics took 4 s on slides that froze Firefox for 30–108 s. The fixes that mattered most were found by profiling Firefox itself, one interaction at a time (scripts/profile_interaction.py), and by counting work instead of timing it (--count-passes).
What limits a slider now, and what it would take
The plan as it stood at 0.43 s a release, with what became of each step. The latest profile sets the next ones. Profiled times; real time is about 1.7× smaller.
- Done: make the worker's reuse check cheap (~280 → ~26 ms). Merkle hashes on expressions plus remembered comparisons (above, #2673). The diff requests (4, below) now let it find most unchanged code by identity.
- Started: redraw less, and only what changed (~310 ms of view building). The page rebuilds its whole view after every action, and each message from the worker was its own action: a release redrew six times, though only one of the worker's four messages had anything new to show. Now the reuse plan and the final stream ride with other messages, and a release redraws four times (#2635
b481a876e1, #2597d92f446112). Main-thread work per release went from 1,141–1,427 to 935–1,051 ms (profiled, two profiles each); the time until the face redraws barely moved, because the redraws removed were off that path. Then each redraw reuses what it drew from unchanged inputs (#263551df91d5d7, #2597a15af020ea). The code view's cache had the whole syntax record in its key, which is rebuilt whenever a result arrives, so the code re-rendered on three redraws of every release for nothing; it now keys on the parts it reads. Closing each livelit event handler's environment, and printing each probe's samples, are now remembered by the identity of the value. Each redraw's own view building, median of 8 releases: preview 18.5 → 14 ms, commit 32 → 25.5, face 90.5 → 83, final result 16.5 → 15; all four 157 → 138.5 ms (−12%). What is left is mostly real work: evaluating the face's view (~70 ms), and the commit's new text. - Dropped: keep a livelit's change out of the text path. The plan was to patch the elaborated program at the model's id and skip printing, re-parsing and re-checking, estimated at ~190 ms. Profiling steady-state releases before building it showed that path is now about 10 ms (profiled): MapPiece keeping identity, per-item parsing and per-item statics had already made it cheap. The one slow case was the first release after a load, which re-parsed everything; that is fixed (above). On #2597, without per-item statics, the step would still save its 3.5 s, but there porting #2469's statics is the better fix.
- Done: send the worker a diff, not the program. Cyrus's suggestion. Unchanged values now go as references by Merkle hash: a release's request is 18.5 KB instead of 478 KB, and release to face went from 359 to 229–273 ms (above). The response, up to 383 KB, is still sent whole.
- Started: make the face's own view cheaper, the largest single cost left. It is evaluated once per release, on the main thread (every other livelit's view comes from its cache), and the profile showed mostly the evaluator's own overhead, not the face's arithmetic. Two fixes so far: ids are minted as plain strings and compared as strings (
7a5667e6f2), and the evaluator binds a run's constants once instead of re-applying itself to them at every node (857c293962). The face's view, warm, median of 8 evaluations over six releases: about 61 → 60 → 42.5 ms. A whole release (263 and 241.5 ms, median of 12, two runs) is within its noise. Then two more, on the evaluator's step machinery: its per-node stages are made once per run instead of eight closures at every node (2d35bb9e01), and two stages that only passed a value through no longer add a trampoline step for it (602498d7aa). The in-page probe could not see these (its medians vary by more than they save), so they were measured with a call-heavy program under node, the way views are evaluated, back to back:Then the bigger step: re-evaluate only the calls whose inputs changed, which took the face's first evaluation after a release from 43 to 12.5 ms.evaluator, 15 evaluations per run min median before the constants fix ( 7a5667e6f2)583–585 ms 638–673 ms constants bound once ( 857c293962)499 607–644 + stages made once per run ( 2d35bb9e01)450–469 529–541 + pass-through binds skipped ( 602498d7aa)408–426 461–479 - A faster evaluator for the views that do change (~170 ms). The face's view must run. The wasm spike (#2490) measured the evaluator about 4× faster under
wasm_of_ocamlon fixed-precision work.
A release is now the livelit's own update, a per-item re-parse and re-check, a small request, a cheap reuse check, re-evaluating the face, and redrawing it: the same shape as Dress Up's path, with the face's evaluation as the largest piece. Dragging is already there: while the finger moves, a livelit runs its own update and view on the page without any of this, which is why the slider itself follows the pointer.
How these were measured
- Headless Firefox over WebDriver, a fresh profile per run, dev builds of #2635, on Matthew's laptop. Wall times are from the slider's
changeevent until the face's eyes redraw at the new size (scripts/slider_timing.py), four runs per build. - Stage times come from the Gecko profiler, started from Firefox's privileged context after load and bracketed with
performance.mark(scripts/profile_interaction.py). Profiled runs take about 1.7× longer than unprofiled ones. - Message sizes:
Worker.prototype.postMessagewrapped after load, with a listener for the worker's responses (scripts/worker_sizes.py). - Dress Up: sixty
inputevents on its eye-size slider in the same headless Firefox; Firefox timers have 1 ms resolution, and the median was 0 ms, the worst 2 ms. - The
devreuse-check benchmark: a 400-definition program, evaluated, then its last literal edited with every id kept; only the incremental re-evaluation is timed, seven runs per build, under node. - Release-to-face timing without the debug panel (
scripts/release_timing.py): twelve releases per build, cycling values, the median reported. Request sizes for the diff requests came from a temporary probe on the encoded message inpost_evaluate. The face view's evaluation was timed by a temporary probe that, on each release, evaluated the view eight more times and logged the median of those eight; a build's number is the median of six releases' medians, and the baseline and the id change were measured back to back. The evaluator benchmark is a temporary test group: a program that builds a 2,000-element list of tuples through recursive helpers and recurses 3,000 deep, run throughevaluate_open15 times under node (the same js_of_ocaml build as the tests), two runs per build, all builds back to back. The call memo was timed by a temporary probe logging each release's first face evaluation, 12 releases per build, the build without it measured in the same session; its correctness check captured the face's SVG after each of 13 scripted slider changes on each build and compared them. The timelines of a release wrap the page'sWorker.postMessageand listen to the worker's messages, and watch the face's eye with aMutationObserver, timing each against the release. Redraws were counted with a temporary probe logging each action and each view. - When a fix's gain is small, it is timed A/B/A: twelve releases with the change, twelve on the same commit without it (rebuilt in place, about 11 s), twelve with it again, back to back. The code editor's sort check is why: the profiler gave it 16 ms per release, and removing it saved 3–5 ms. Code made of many small calls slows down more under the profiler than the rest. The tiles re-checked per commit on the
megaprograms were counted by a temporary print in the test. - Scripts are in
~/hazel-livelits-modular/scripts, untracked. Details and discussion: hazelgrove/hazel#2609, findings 10 and 11. - The numbers, for programs too: every table in this report, and what its numbers measure, is also in this page as JSON, in its
<script type="application/json" id="report-data">element, so a reader or an agent that fetches the page alone has the dataset. The same, with any raw files that survive, is indata/.